FOLLOWING THE AUCTION, LOOKING SPARSE UP HERE?

This week in Following the Auction, we’re looking at recent price action in the S&P 500 and recent action in the EuroStoxx 50. 

News this week from the worlds financial gurus was a riot with Warren Buffet declaring he did the research and 6-year-olds have the lowest death rate in the world, so he strategically developed a diet to mimic that of a 6-year-old boy. He’s enjoying his PB&J’s and lots of Coca Cola… 5 a day! (do you think he owns KO?)  Buffet is also known as a value investor as was another financial guru who passed away this week, Irving Kahn. Kahn, born in 1905, had an understanding of the concept of value investing prior to the stock market crash of 1929, when  he noticed that traders were bidding stock prices into the stratosphere. Selling short 50 shares of red-hot Magma Copper that June, Kahn wagered the price would plummet. When the market crashed on Oct. 29, his $300 investment, about $4,000 in today’s dollars, more than doubled. On an NPR interview in 2006 he said, “I wasn’t smart, but even a dumb young kid could see these guys were gambling. They were all borrowing money and having a good time and being right for a few months and, after that, you know what happened.” Interesting comment to think about… fear and greed… always an integral gear to the auction. 

Talking about value investing relative to our current market prices versus Europe and some say European stocks look very cheap, especially compared to the U.S.  investment strategists are mixed on whether to overweight or underweight Europe but agree investors would be wise to include some exposure in their portfolios. As futures traders we worry less about the investing aspect and more about volatility, ATR and margin. However, we track smart money footprints and resulting trends. With the financial worlds’ eye on Europe and Dragis’ QE, let’s take a closer look at the S&P 500 and the EuroStoxx 50. While the S&P 500 has 500 stocks and the EuroStoxx 50 has only 50 stocks, it nevertheless is a very liquid market and over the last decade has become more popular with day-traders in the US, and clearly longer term investors as well. Note the following information on both charts, please click to enlarge.

  • High in 2000 – ES 1655.25 – EX 4941
  • High in 2007 – ES 1466.75 – EX 4060
  • Low in 2009 – ES 530.50 – EX 1188
  • Current price (circled in yellow) in relation to above highs and lows
  • Lower pane chart shows the United States Dollar vs the Euro currency.

comparechart

Note these two indexes relative to the old highs from 2000 and 2007 and where they are now. The S&P 500 broke the trendline the end of 2012, the EuroStoxx 50 broke the trendline last month.  Not to be ignored are the currencies in the lower chart pane,  see the dollar in a short squeeze and liquidation on the euro. Note the euro has broken the 1.18/1.19 level (grey horizontal line) it has held as support over the last 10 years as the dollar is coming close to hitting the 1.00 level, it’s resistance over the last ten years. 

Clearly the trend is up on both indexes but the auction in the S&P got a little tired last week as evidenced by an RTH (regular trading hours) excess high. The last all-time-high at 2088.75 was a market profile ‘poor’ high which implies an unfinished auction. Wednesday’s high of day at 2117.75 left a 3 TPO ‘excess high’ and marks the end of the auction, for that period in time. While the excess certainly marked the high for last week, with 3 days of one-time-framing lower, value moving lower yet not quite reaching 2099.50, the lower BAE (balance area extreme) upper limit. Staying above 2099, LVN (low volume node) keeps the weekly trend up and challenges the excess high. Acceptance below the LVN targets the two prominent HVNs (high volume nodes) below at 2096.25 and 2093.25. Carry forward information, a poor low from 2/23/15, 2099.75 an additional poor low from 2/20/15, 2082.25 and a gap between 2070 and 2071.50. Two poor highs, Thursday and Friday.

A final day-trading comparison chart between the EuroStoxx 50 and the S&P 500. The charts compare last week, the EU on a 24-hour chart, the US day-session open marked with a grey vertical line. The ES chart is the day-session only. I think the arrows give a relatively good feel for how the week progressed in both markets. Please click on chart to enlarge.

esvsex

Coming into the final month of the quarter, what shall we expect? Register for FREE on the website and then get your coffee and open Pat Tabet’s Pre-Market update, waiting for you upon login. Then, Charles Cochran posts commentary on the ES, ZB, CL and 6e with actionable trading levels based on volume profiling! Heading into the open, Lewis Borsellino will get down to business with the Man Over Market’s Morning Call. When you’re asking.. whaddawedonow?The MOM team has answers!  

Have a spectacular week! Trade smarter… not more often!

LIVE TRADING, WEATHER PERMITTING… TODAY’S CHARTS AND LEARNING

Enjoy this after the close! Lewis Borsellino’s ManOverMarket live trading and education videos are an hour packed with charts, trading (when the market is moving), proprietary indicator descriptions, market profile education and entertaining stories from Lewis’ Pit Days!  Watch this one later… catch the next one live! Check the twitter feed for upcoming dates and times so you can mark your calendar. Each session Lewis will answer questions from viewers through his ManOverMarket twitter feed. Listen to him explain how he leans on the bias and uses his chart indicators developed by Pat Tabet and ‘tweaked’ over 20+ years! Bring your questions next time… Traders… this is great stuff! 

Here is the link to today’s video.. http://t.co/bTsuPd1xdB 

scr

lewisutube2

FOLLOWING THE AUCTION – MARKET PROFILE TRADE, IT’S NOT GAMBLING!

This week in Following the Auction, we want to look at a classic low risk, high odds trade viewed through the Market Profile chart utilizing all of MOM’s tools to load your dice! After that, we’ll look at the same chart merged into a mico-composite to look at the classic high odds Market Profile BAE (balance area extreme) opportunity and show the results of trading the setup with a 3-lot unit management.

First, take a look at a market profile chart. The information on the chart came from Pat Tabet’s Pre-Market Update that’s available for FREE on our website before i’ve poured my first cup of coffee. We see the proprietary BULL/BEAR ZONE highlighted. Support is also indicated. Resistance and targets for the day are there as well. Also from the pre-market, we know the average rotations on recent activity. Lewis Borsellino posts his Morning Call youtube video indicating the MOM proprietary bias, his market analysis and his plan of attack on the day. Take a look, click to enlarge.

ckAdditional support to keep your trading on the profitable side of the market comes in the form of Lewis’s twitter feed as he updates followers with current market movement, while watching MOM’s proprietary tools and following the auction, play by play through the entire trading day. Click to enlarge.

Lewistweetscroll

Finally lets cover Friday’s classic Market Profile low risk, high odds trading setup. The chart below shows the balance area that formed over the 5 days coming into Friday 2/20/15. The chart is the same as the chart above except the days of overlapping value have been combined to form a micro-composite. Note these charts are profile only charts and show no volume, however the trade would be best managed by watching the volume at BAE low when considering entry. The trader would not want to see increasing volume at BAE low if stalking the long entry. Note that 2082.75 marks the BAE (balance area extreme) on the low end of balance and 2099.50 markes the BAE on the high end of the balance area. After that it’s what we call the ‘If… then scenario”. If BAE low holds… BAE high will be tested. While there are many ways to approach this trade, I like to use 3 units. If you buy BAE low with 3 units, take one unit off at POC. The target for the 2nd unit is BAE high, leaving a final unit for a possible break-out. I wish we had trades like this daily, however what makes this one great is the time it takes to properly setup. But a developed balance area makes for a great ride! Click to enlarge.

BAErules

That raps up this post! You can’t call it gambling when smart technical analysis informs your risk management! Remember, sign up on our website for Free and get this stuff! Listen to Lewis’s Morning Call and get in the game! 

Have a great week! Trade smarter… not more often!

SPECIAL REPORT – YOUR UPDATE FROM THE WORLD ECONOMIC FORUM

Here is a summary post of the wrap-up discussion on the closing weekend of the World Economic Forum held annually in Davos. The panel was composed of the following people, Christine Legarde – the managing director of the International Monetary Fund, Gary Cohen – Goldman Sachs COO, Larry Summers – Former US Secretary Treasurer, Ana Patricia Botin – Banco Santander Chairman and Ray Dalio, Bridgewater Assoc Chair CIO. Their questions and comments are insightful and revealing about the current state of the Euro zone. 

cgl

Europe is leaning on the results of the United States QE, and evidence shows Dragis’ QE is already working. Spain has inspired confidence due to fiscal discipline, structural reform and the cleaning up of all banks on non-preforming loans.

Considering Gary Cohens’ Fallacy of Composition comment (below) Christine posed the following question… Given we are in a low/low, high/high environment in the Euro area, meaning low inflation, low growth, high unemployment, high debt environment… plus… given that structural reform takes time and deals with the supply side, where effectively what we need is demand and structural reform… can you stimulate demand by either monetary policy (monetary policy is at the end of its course) OR by fiscal expansion? Knowing that only maybe 2 countries in the Eurozone are ready to do that… is that enough to pull out of the LL, HH environment?

Gary responded noting Europe has a lot of ‘fiscal space’ but to adopt a common currency without a decision to use common fiscal space was/is an irresponsible decision. Therefore having made a common currency decision if it’s not to become a failure there’s no choice but to find mechanisms to support fiscal expansion on a common basis. Additionally it’s not being realistic about liabilities when you under-fund a pension you are placing a liability on the future… if you sell a building, but rent it back, all you’ve done has not changed anything really. But it does upset the long term math.

Wrap-up. It’s a mistake to compare economies except at the currency level. There is no Euro zone fiscal policy. The balance sheet is great but they’re not willing to go into binge borrowing at low interest rates. Much has been done in the last five years but fiscal union and banking union needs more progress. Huge potential in the Euro zone, but to think of it as one economic unit is not yet the case.

There are some big trade deals in the works and also a huge climate project. All of the countries need to pull their weight and all need to rally around the job and growth objectives in the works to create jobs.

raydalio_001

We’re in the “End of a Super Cycle” or The New Normal… in which lowering interest rates causing higher levels of debt and debt servicing spending has come to an end. Since 1980 every cyclical peak and trough in interest rates was lower than the one before which is a deflationary set of circumstances. With 0 or (-) interest rates, it begins to call in the value of holding money.. what is money? 

The downturn in the economy lowers the ability to control using monetary policy which works by lowering interest rates, which in turn lowers debt servicing payments and asset values increase. These two things together create a wealth effect and stimulation to the economy.The spread is the transition mechanism for monetary policy. when the spread was wide, people bought for higher returns, the result is the spread narrows to NO spread, and this is on bonds and futures as well as yields on equities.There are two levers… interest rates and currency. When interest doesn’t work, currency becomes more effective. There is a need for further depreciation of the Euro and the Yen. Note… the average cost of an European worker is 2X what it is of an American worker. Structural reform is needed to make that more efficient, and there is lots of opportunity to do that in Europe.

Currency depreciation has to be a part of it, it’s not a polite conversation. Currency will be a bigger influence ahead and this will produce a dynamic. Globally there is a lot of dollar denominated debt that’s becoming more expensive. A short squeeze is emerging in the DX similar to 1985. Back then there were falling commodity prices, falling oil prices, a relatively strong economy with falling inflation. Then we could lower interest rates, not now. 

Wrap-up –The US has twice the rate entrepreneurships of Europe. Yet it’s hard to compare economies for example… youth unemployment is actually higher in the US. The US is optimistic about a productive force that is big data when we’re at that tipping point of not being able to use debt in the same way. For Europe, credit is not going to work the same way as it did before. Debt growth, don’t look to it as the solution. You can spend with debt or with currency. The ECB needs to put more money into the system, money can produce purchases. Structural reforms and currency changes together would be a constructive force for Europe.

anapat

Balance is like a four-legged chair between monetary policy (QE), fiscal policy, structural reform and TM, the transitional mechanism.

There has been deflation pressure on the banks. Out of a sample of 300 banks, many say they are more ready to help monetary policy work today, meaning to start lending again, but many are NOT in that position. A sample of forty of the largest banks in Europe, 2007 vs today, risk assets are at the same level, capital is more than double… return on equity is now 6%. This says banks are ready to lend again, in fact over the last year lending has grown by 4% in 9 out of 10 countries.

Related to PPP, purchasing power parity, the prevailing view is to have a lower currency to export against and generate tourism with which is another way of saying stimulate economic growth. The currency now is around 115, (114 at time of writing) about the correct level, the problem is where we came from which was a result of the US QE. 

Wrap-up We’re ready to lend (!) an essential part of monetary policy. We need a balanced approach to regulation that takes into account the broader public policy issues discussed today.Noting she is a lot less negative about Europe than the rest of the panel, she stated “America is an emerging market in terms of growth and has strong institutions and that’s quite unbeatable.” 

larry_summers

The risk of doing too little far exceeds the risk of doing too much, relative to the Euro zone’s QE. Deflation and secular stagnation are the macro-economic threats of our time.

  1. Mistake to think QE is enough, several differences with US experience.
  2. US QE was most effective at the beginning when markets where functioning less well than how they’re functioning in Europe today.
  3. QE worked well with interest rates in the 3% range, not with rates where they are now.
  4. QE also worked best when it was unexpected, rather than when it had been widely predicted.
  5. There are two channels, the capital market channel vs banking market channel and the banking market channel is still clogged by regulatory processes.

Wrap up – expect QE to be less impactful in Europe than it has been in the US. Europe has more complex institutions. Note*** No government has ever predicted a recession 1 year in advance. What happens is every 7 years, the fed lowers interest rates to combat deflation but you can’t cut anything from zero. There is a need for direct support for investment from public and private sectors. Recognize that the era when the central bank improvisation growth strategy working… is coming to an end.

garycohen

What happened first… the transitional mechanism (TM) was broken which created the ‘New Normal’

Pre – 2008 – Central banks decided what monetary policy would be. They would lower rates and increase money supply. They would flow it through banks, banks would flow it to customers, and from there to mainstreet. And it worked. They were able to control growth and the flow of currencies through regulation. Post – 2008 every time banks get money they build their balance sheet to make sure they’re bullet proof for the 10,000 year flood. As Ana said, she’s not distributing the funds but holding, and it seems that process is getting worse in Europe.

Everyone on panel must agree that austerity and acceptance of limited monetary accommodation in hopes that it will drive structural reform has proven substantially counter-productive. Instead where these policies are being applied, they are bringing radicals to the fore, indicating the situation in Europe is not yet in hand.

It’s good and desirable that the currency is lower. The worry is because there is already a set of positive developments from QE, yet forecasts look dismal from here… and QE is already built into these forecasts… so don’t mistake thinking Europe is in hand.

Wrap up – The coming of technology is more advanced in the US, which brings us back to the central point, Demand. The basic idea is a concept called the Fallacy of Composition. Here’s the classic example – if one person in a group stands up, he can see better, but if everyone stands up, no one can see better and, everyone is uncomfortable. So if any one country saves more or any one bank hordes capital, it will strengthen its’ position. But if all countries save more, there will be less spending…  which will mean less income… which will mean less spending… which means… it will NOT get better. The central error that’s running Europe right now is that what worked for one once when applied universally will work for all. As long as that attitude exists success will be limited.

FOLLOWING THE AUCTION – Supply and Demand

This week in Following the Auction we’re taking an interesting look at Supply and Demand and how it affects the auction.

Valentine’s Day weekend deserves a little attention as it drives sales at Hallmark, 1-800-flowers, and Godiva Chocolate, traditionally. This year however, there’s a new trend that’s driving sales and it’s not for chocolate unless it’s in the form of body paint. This Valentine’s Day saw the release of the long… hotly awaited… Fifty Shades of Grey. The movie is notable for its explicitly erotic scenes featuring elements of sexual practices involving bondage/discipline, dominance/submission, and sadism/masochism. Hollywood, like the market is a profit machine. The book got Hollywood’s attention due to it’s erotic nature yet ever growing popularity with public audiences.  The book came out in June of 2012, 2 months later it had grossed almost half a billion in sales.

So it should come as no surprise that demand is up! Leading into this Valentine’s Day, the movie primed the pump, so to speak and sex-toy sales have skyrocketed! Britain’s sex toy sales are up 25% coming into this traditional ‘candy / flower’ day. Surprise or no  Mississippi led the way in U.S. presales of the “Fifty Shades of Grey” film. So these much talked about books turned popular movie has opened the door to mainstreets  roaring demand for sex toys… even Target, the store that boasts ‘Our mission is to make Target the preferred shopping destination… by consistently fulfilling our… Expect More… brand promise. Ah, thank you Target for making my Valentine’s Day shopping easier!

Much like Hollywood… the Market had an exciting day last Friday when the bulls showed the bears who holds the riding crop. The candlestick day-session-only chart below shows all of 2014 and ends Friday 2/13/15. Each triangle shows a swing high/swing low move starting from the low of the year, 1702.75 to 2088.75, the high of the year. Several Fibonacci extensions from these swings intersect as shown on the chart, click to enlarge.

5triangles

Notice what happened each time the market made a new high. Not many days go by before there’s some long liquidation and a new swing low eventually is created. I would never suggest getting in front of an auction that’s trending that doesn’t show excess and additionally has just broken out of a 6-week balance . However, successful day-traders carry forward poor structure below current price, so they can recognize early in a session that an uptrend reversal can lead to extreme long liquidation, perhaps not today but in a future session.  It is important to recognize so that the trader positions himself with the liquidation instead of waiting at support levels to jump in front of the knife. Put those handcuffs on!

With the value of the dollar also at highs there’s speculation that US stocks are under pressure.  Lower crude oil prices have also taken a toll, not yet complete, on energy stocks and other sectors too.  Yet Apple’s on new highs with lots of attention on – going solar and creating a car to compete with Tesla! To add a broader perspective,  Ana Patricia Botin,  chairman of the board of Banco Santander, representing the banking world globally, made a pretty bullish statement during the 2015 World Economic Forum that ended last weekend. At the same time discussing reaching parity between the USD and the EU currency, she also said, “America is an emerging market in terms of growth and has strong institutions and that’s quite unbeatable.”  So bullish even with the dollar at current prices.

So here we are at New Highs and we’re all pretty excited about giving the bears a good whipping. I’m just suggesting, now that we’ve made the higher high… don’t forget to watch your backside.  As futures traders we’re loving it. New Highs? Yeah baby!     WAAAAPISHHHHHH!!!

Don’t forget President’s Day has the market closing early at 12:00 pm CT on Monday, 2/16/15. Join us for Free, sign-up, or else! We promise to provide you with our best toys… the Bull/Bear line and the MOM bias, Lewis’s MOM twitter feed…  are in Demand so don’t get left out of the excitment. Pat Tabet, Charles Cochran and Lewis Borsellino will lube your market day with actionable updates!

As always, i want you to be a smarter trader…  or else… WAAAAPISHHHHHH!!!


FOLLOWING THE AUCTION – MARKET PROFILE BASIC LANGUAGE

FOLLOWING THE AUCTION this week we want to answer some requests and go over some basic profile language and definitions. Remember explaining market profile is a book! So to keep it short enough for a post, we’ll cover some basic information viewed through the window of the last two trading days, and continue to cover additional terms in future posts.

In the chart below we see Thursday and Friday, February 5 and 6, 2015 represented by a Market Profile chart. Market Profile charts are available from a variety of software companies. The MP software you see in Lewis’s charts comes from Inside Edge, and is excellent. Look under the education tab where you’ll find a 3-part Market Profile Class by Charles Cochran. Inside Edge market profile software’s focus is the directional movement of volume through time and the distributions. The software below is easy to see for my purposes and so below on the left we see the profile closed and on the right we have key references marked from Thursday as we come into the trading day on Friday morning. Click to enlarge.

MPCLOSE.OPEN_1346The profile is composed of TPO’s, and each letter is considered a TPO. The opening bell at 8:30 Chicago time starts with the letter A and represents the first half hour of the trading day. At 9:00 a new half hour starts with letter B and continues to 9:30, together period A and period B form the IB or Initial Balance. The day progresses with each half hour and a new letter, until the bell rings at 3:00 pm, actually very similar to a bar chart. Of course the market trades virtually 24 hours however we collect the data via session times and the chart above shows the US day session only. These are generally the most active trading hours as the unlying stocks are also trading, sometimes however there is significant market moving news during the US overnight.

Additional terms, VAH, VAL, POC, VPOC and Singles. Above value is represented by the blue colored TPO’s, the grey TPO’s are out-of-value. The Value area is defined as the range of prices where 70% of the TPO count occurred. The VA represents where the majority of market participants traded. VAH and VAL are value high and value low respectively. POC is the price at which the highest number of TPOs’ occur and is short for Point-of-Control. VPOC we covered before in a post specifically about VPOC and is the VOLUME Point-of-control, note there is no volume showing on this MP chart. Consider value time relative, for the purpose above we’re looking at value related to individual days. Above we can see value is overlapping and higher from prior day.

Let’s narrate how the day unfolds via market profile…

  • Coming into the open the market has rallied off better than expected employment news, A period trades down to VAH from Thursday and finds responsive buyers.
  • B and C period one-time-frame up, slowing at 2067.25, the end of the single print TPO’s from 12/31/15.
  • D period is an inside bar which doesn’t end one-time framing.
  • E period makes an equal low to C period, can not take out C;s high-of-day, and stops one-time-framing higher.
  • F period, very tight, stays above developing value on the day but is unable to get above E period high,
  • Without upside extension possible G period has a liquidating break and stop run below E and B period lows and then rallies back toward the scene of the crime.
  • Unable to get back to G’s high, H period auctions down to one tick above key reference, Thursday’s POC at 2052.25 and stops.
  • I period trades to within a tick of H low, now the low of day, leaving a ‘poor low’. A poor low or poor high is defined by anything less than 3 TPO’s of singles. H period is one tick lower than I period. Poor lows and poor highs are frequently revisited as they represent an ‘unfinished’ auction. However all trading decisions are best made in context.
  • J period holds ‘Unchanged’, which is the prior day’s close, and looks above I period by 1 tick.
  • K period opens and continues to push back toward Friday’s open, 2061, with a 2 tick peek above, the open is rejected and the market auctions lower, having clearly rejected Friday’s open… time to check Thursday’s open.
  • L period continues the push down taking out our ‘poor low’ as expected.
  • Stopping a tick shy of Thursday’s open, M period, now going on 3 pm, rallies back to the fairest price on the day, POC, 2053.75

Trading with the developing value and keeping track of the profile is an easy, organized way to FOLLOW THE AUCTION!  There are a minimum of 4 trades in the above chart with asymmetrical opportunities for stop placement and targets based on just the key references from the prior day and the TPOs. The profile will keep you grounded, take your references one at a time, watch volume, watch tempo, look for acceptance or rejection at your references and… FOLLOW THE AUCTION! 

Click here for a link to the CME group 6-part study guide to Market Profile.

Man Over Market has some exciting developments coming! Sign-up for FREE on our registration page to get the early pre-market goodies from Pat Tabet and Charles Cochran. Then Lewis Borsellino will take you through the trading day with his plan, updates about MOM and in general… colorful market commentary!

Have a great week! Trade smarter, not more often!

FOLLOWING THE AUCTION – ANY GIVEN MONDAY

This week in Following the Auction we’re going inch by inch, play by play and looking at just one high odds game play to put in your deck. With Super Bowl Sunday dominating the United States television viewing audience it’s a great time to watch the inspirational Inch by Inch speech Al Pacino gives before the football game in the movie ‘Any Given Sunday’.  

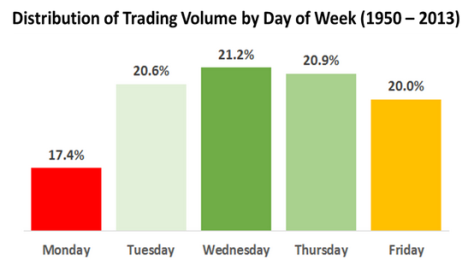
As we head into the trading week, what should we expect? According to exclusive data and analysis from big data analytics firm 1010 Data, the Monday after the Super Bowl looks like any other Monday—unless the New York Giants were playing the night before, or if the game was really close. Apparently if the game is a nail-biter people stay up later. However Monday’s in general do apparently suffer slightly lower volume as seen in the chart below shared from the 1010 Data Blog.

mondays

Inspired by Super Bowl Sunday, check out the graphic below… here’s a play to put in your trading deck! Consider it an ‘Inch’. Trading is a game of inches. The inches we need are everywhere around us! Add ’em all up… and it makes the f-ing difference! This scenario can be seen on all time frames from the 5 minute chart used in the example below to the daily chart and the concept is the same. See the volume on the 5 minute ES chart from last Friday. The highs lined up starting from the left, 28, 31, 27, 133, 119. The setup, or ‘Play’ is the Stop Run. Looking at the yellow circle we can see the sellers drying up, looking above we know there are likely stops above each bar high in the downtrend. The Stop Run is the game and the destination is the high. As soon as you see the volume dry-up, get in with your stop below the low for the potential short covering and Stop Run. (Don’t overstay your welcome.) Inch by Inch, play by play… add it up.

the play

Our site registration is FREE! Get with the MOM team! Pat Tabet, Charles Cochran and Lewis Borsellino will keep you in the game or tell you if they’re on the sidelines… waiting for the next Play…  Pat and Charles start the morning with updates and the Bull/Bear line, support and resistance for the ES and other markets. Lewis will keep the day lively with his play by play,  and updates on the market game.  

Have a great week! Trade smarter, not more often!